
Policy on Climate Change and Natural Capital
Approach to Climate Change and Natural Capital
Based on the idea that it is essential for our sustainable growth to realize sustainable society, we also believe our contribution to solving social issues through our business is in line with our fundamental philosophy of “securing stable profit over the medium to long term” and “steadily achieving growth in assets under management.” Consequently, it would contribute to improving our unitholder value.
Responses to climate change and natural capital are urgent management issues for NMF in undertaking sustainable business activities, and we have positioned it as a particularly important ESG issue (materiality).
We will continue to advance our sustainability initiatives by addressing key issues related to climate change and natural capital.
Integrated TCFD/TNFD Disclosure
- Nomura Real Estate Asset Management, the asset management company of NMF, recognizes responses to climate change and natural capital as urgent issues. We thus endorsed the TCFD recommendations in July 2020 and joined the TNFD Forum in 2025.
- In March 2024, NMF disclosed non-financial information in accordance with the TCFD recommendations. Furthermore, in April 2026, we identified and disclosed nature-related risks and opportunities, as well as priority areas, based on the TNFD LEAP approach.
- We disclose information regarding climate change and natural capital in accordance with the four frameworks for TCFD and TNFD: governance, strategy, risk management, and metrics and targets, as outlined below.
This table can be scrolled sideways.
| Item | TCFD | TNFD |
|---|---|---|
| Governance |
|
|
| Strategy |
|
|
| Risk Management |
|
|
| Metrics and Targets |
|
|
Strategy:Climate Change Scenario Analysis
NMF conducted a scenario analysis to identify the risks and opportunities that climate change may pose to the Investment Corporation and to assess their potential impacts on its business. In conducting the analysis, NMF took into consideration Japan's Green Growth Strategy Through Achieving Carbon Neutrality in 2050, which was formulated based on the government's declaration of achieving carbon neutrality by 2050.
Scenario Analysis Assumptions
NMF conducted scenario analysis using future climate predictions announced by various international organizations and other groups as the main information sources. The main information sources referenced by NMF are indicated below. Climate change risks can be broadly classified as transition risks and physical risks, and it is believed that the relationship between these two types of risks is one of interdependence and trade-offs.
This table can be scrolled sideways.
| Climate Change Risks | Main Information Sources Referenced | |
|---|---|---|
| Transition risks | Risks arising from new regulations, tax systems, technologies, and so on introduced to create a decarbonized society | IEA (International Energy Agency) World Energy Outlook 2023 International Energy Agency (IEA), World Energy Outlook 2023 |
| Physical risks | Risks arising from climate change itself, such as changes in weather | Intergovernmental Panel on Climate Change (IPCC), Fifth Assessment Report (AR6) |
In light of the intent of the Paris Agreement, NMF set three patterns—a 4°C scenario, 2°C scenario, and 1.5°C scenario—as the assumed scenarios for scenario analysis. Overviews of each scenario are set forth below.
2°C Scenario and 1.5°C Scenario
The 1.5°C scenario assumes that greenhouse gas emissions will trend downward as a result of the adoption of more strict regulations, tax systems, and so on to achieve a decarbonized society. This scenario entails low physical risks and high transition risks.
The 2°C scenario is positioned between the 4°C scenario and the 1.5°C scenario and assumes that greenhouse gas emissions will be curtailed to some degree as a result of the adoption of more strict regulations, tax systems, and so on, similar to the 1.5°C scenario. This scenario entails low physical risks and high transition risks, but not to the same degree as the 1.5°C scenario.
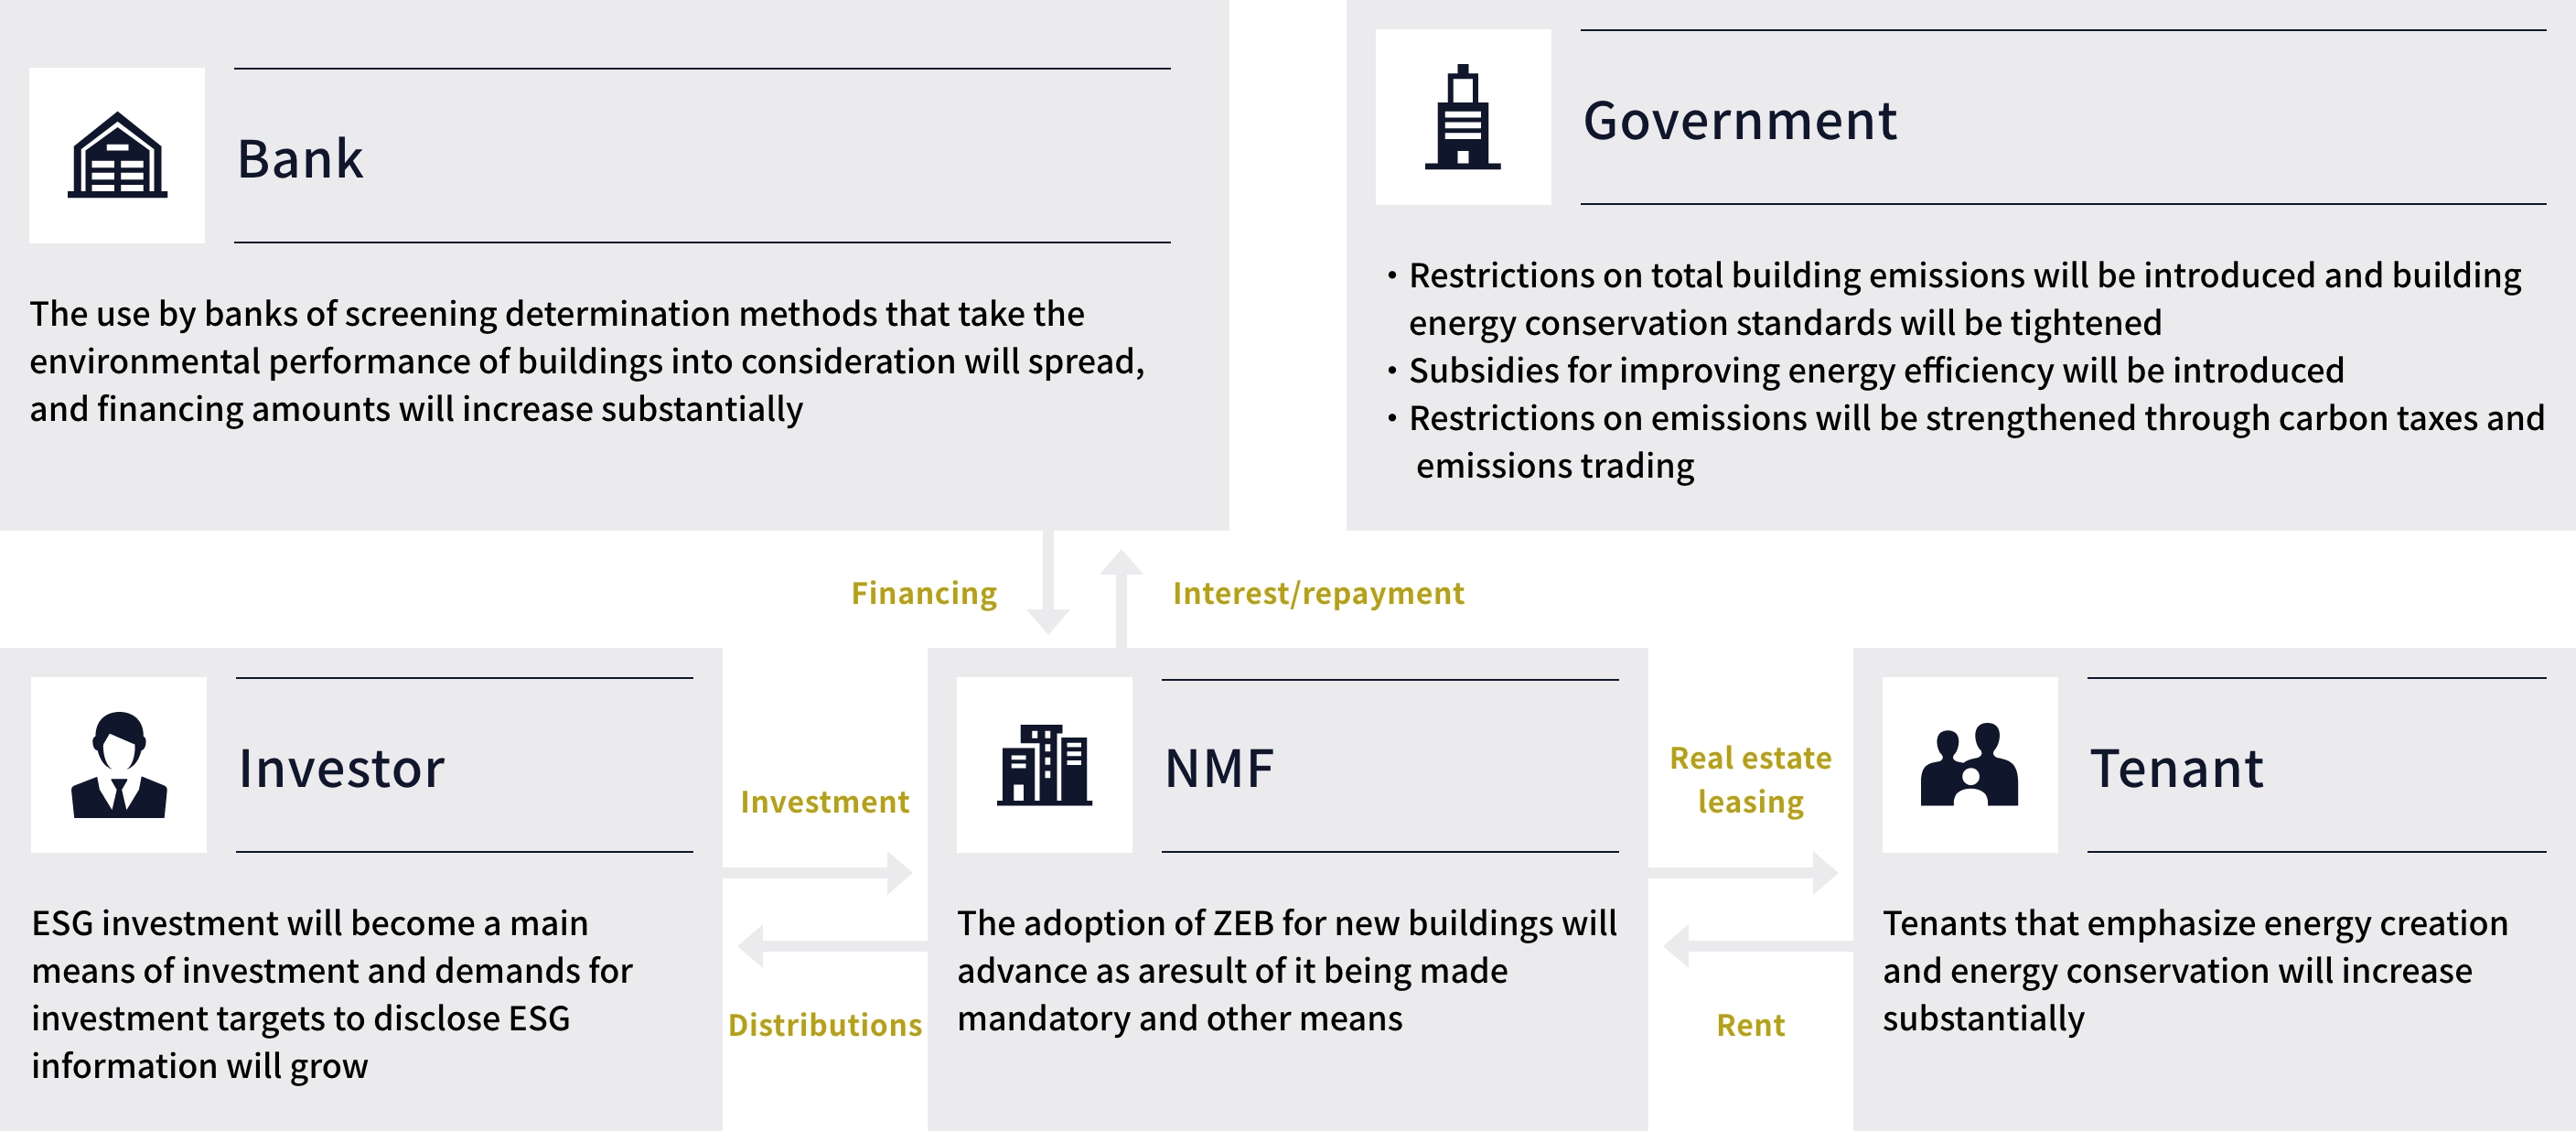
4°C Scenario
The 4°C Scenario assumes that more strict regulations, tax systems, and so on will not be introduced to create a decarbonized society and that greenhouse gas emissions will continue to increase. This scenario entails high physical risks and low transition risks.
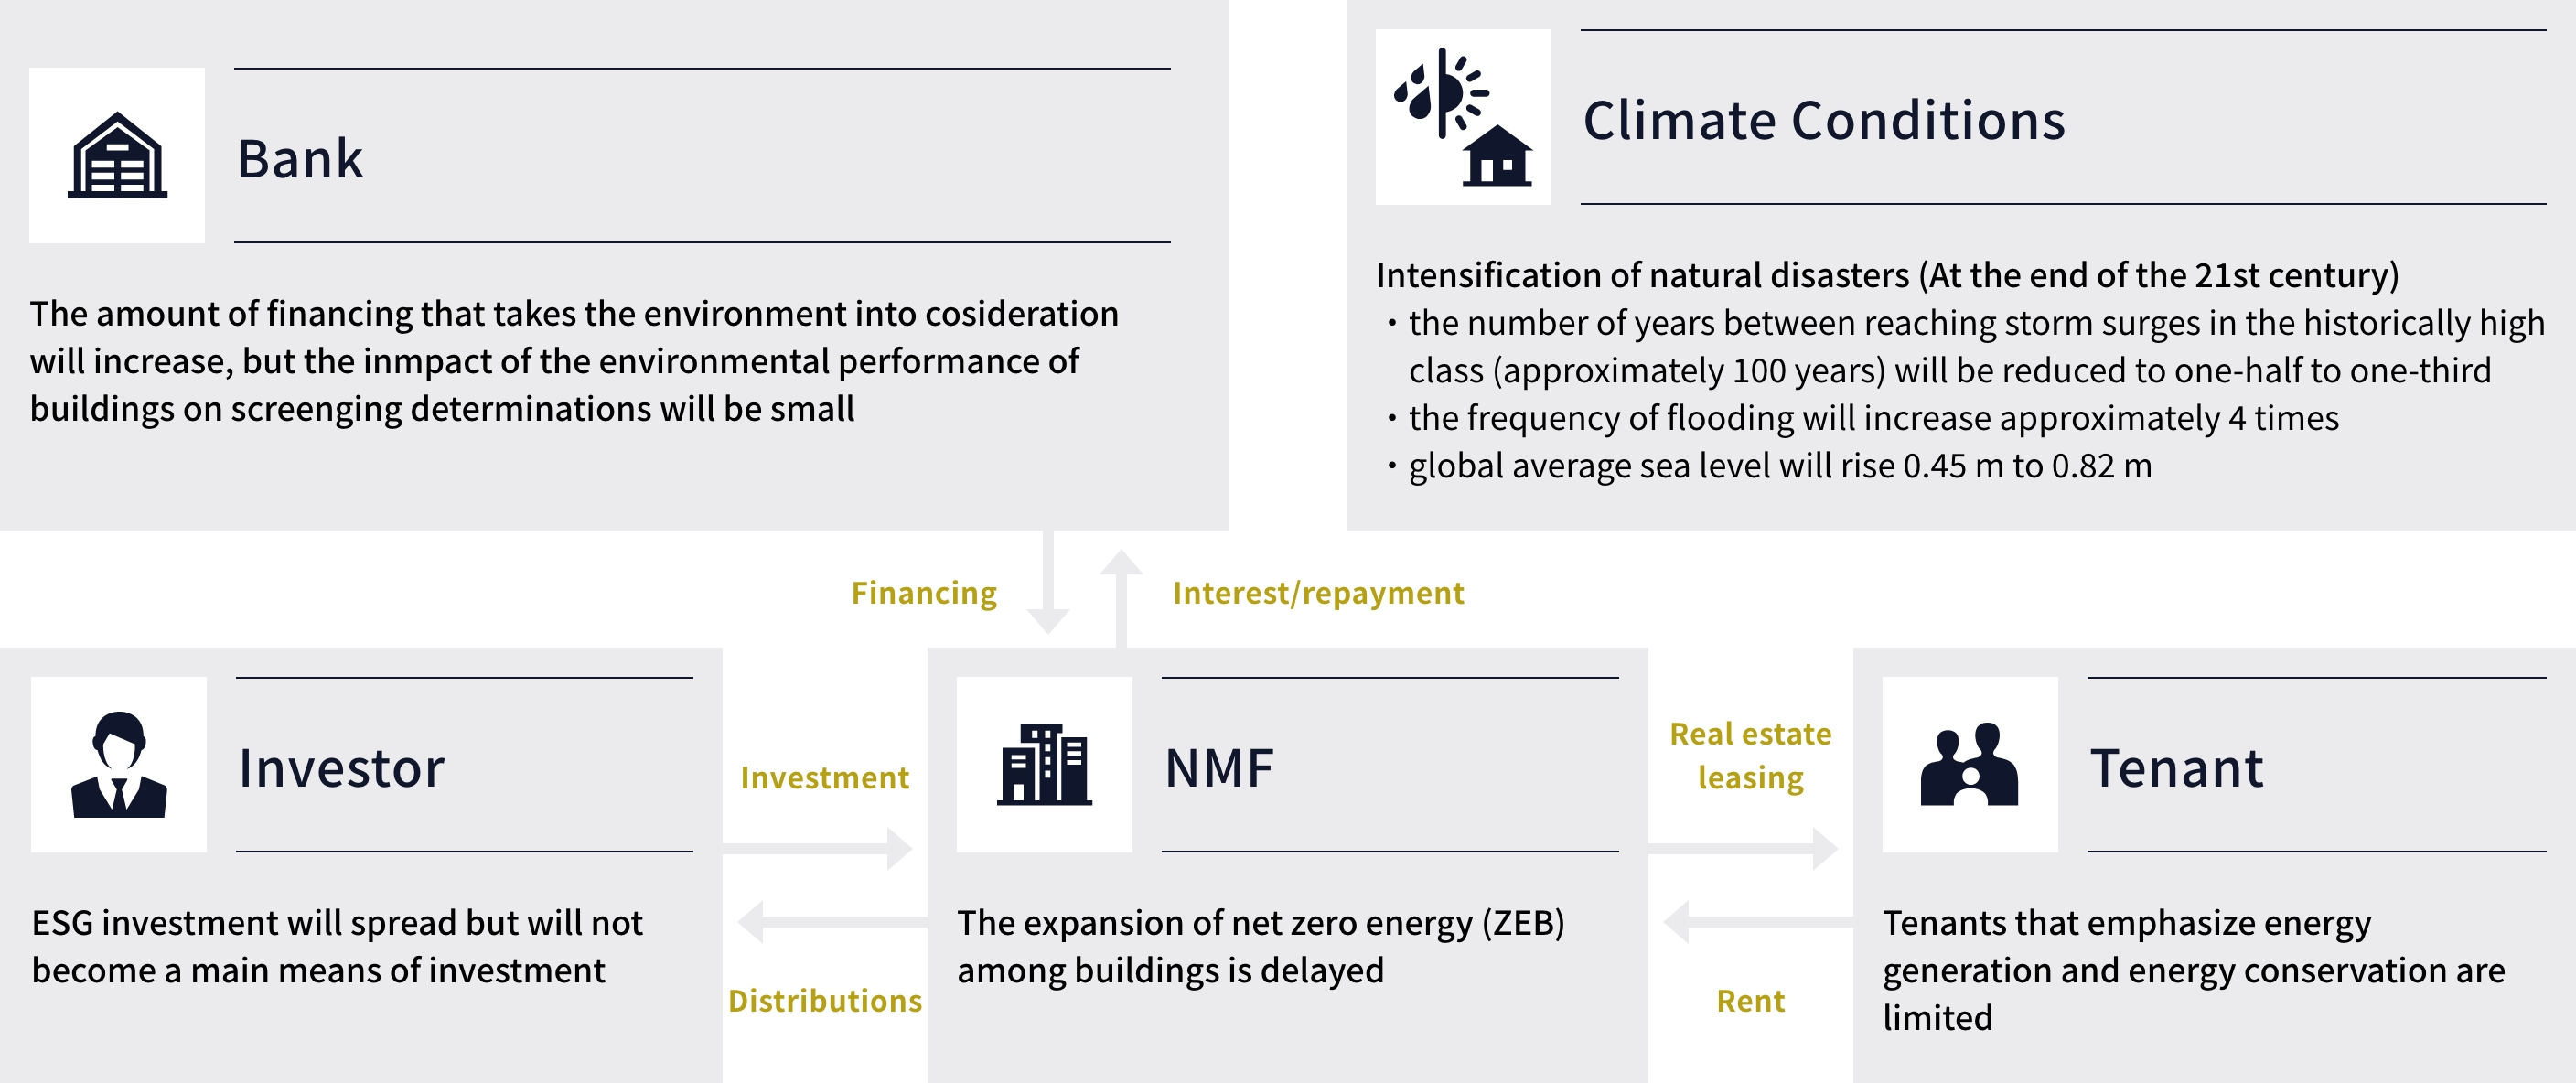
Verification of Financial Impact Amounts Based on Scenario Analysis
NMF verified the scope of the financial impacts from the identified risks and pportunities for each of the three scenario patterns described above. Impacts were verified at 2030 (medium-term outlook) and 2050 (long-term outlook) for each scenario. A summary of the results is set forth in the table below.
This verification made reference to scenarios announced by the IEA, IPCC, and other organizations, objective forecast data announced by other third-party specialized organizations, and other data available at the time, and involved qualitative and quantitative verification based on the status of the NMF's asset holdings, but the known risks entail uncertainties, and unknown risks and other factors are inherent, and consequently, there is no guarantee of the accuracy or safety of that information.
1.5°C Scenario
This table can be scrolled sideways.
(hundred million yen)
| <Changes in the world> | <Risk details> | <Details of opportunities/risk reduction and corresponding costs> | |||||||||
| Category | Risk | Financial impact amount | Opportunity/Response cost | Financial impact amount | |||||||
|---|---|---|---|---|---|---|---|---|---|---|---|
| 2030 | 2050 | 2030 | 2050 | ||||||||
| Policy | Introduction of carbon tax system | Transition risk | Incurrence/increase of carbon tax burden | (Single year) ▲4.7 |
(Single year) ▲8.5 |
 |
Risk mitigation | Reduced burden of carbon tax due to energy saving construction and introduction of renewable energy electricity | (Single year) +3.7 |
(Single year) +6.6 |
|
| Required cost | Cost increase due to introduction of renewable energy electricity | (Single year) ▲0.3 |
(Single year) ▲0.3 |
||||||||
| Market | Increasing number of companies aiming to become carbon neutral Selection of properties with emphasis on energy creation and energy saving performance by tenants |
Declining competitiveness of properties with poor environmental performance (properties that have not obtained environmental certification) | (Single year) ▲13.0 |
(Single year) ▲13.0 |
|
Opportunity | Improving the competitiveness of properties with high environmental performance (properties with environmental certification) | (Single year) +9.4 |
(Single year) +9.4 |
||
| Risk mitigation | Restore and improve competitiveness by improving environmental performance (obtaining environmental certification) | (Single year) +4.6 |
(Single year) +4.6 |
||||||||
| Required cost | Environmental certification acquisition and maintenance costs | (Single year) ▲0.3 |
(Single year) ▲0.3 |
||||||||
| Changes in banks' lending decisions based on the Principles for Responsible Banking | Decrease in funding costs through green loans, etc. | ー(*1) | ー | ー(*1) | |||||||
| Acute | Increasing severity of natural disasters | Physical risk | Occurrence/increase in property damage due to floods and storm surges and decrease in rental income due to business suspension | (Cumulative) ▲8.0 |
(Cumulative) ▲36.2 |
|
Risk mitigation/Opportunity | Generation/increase of insurance income | (Cumulative) +8.0 |
(Cumulative) +36.2 |
|
| Increase in non-life insurance premiums | (Single year) ▲0.1 |
(Single year) ▲0.6 |
|||||||||
| Chronic | Increase in average temperature | Increase in cooling costs | (Single year) ▲0.1 |
(Single year) ▲0.1 |
Reduce heating costs | ー(*1) | |||||
| Total (①) |
(Single year) ▲18.0 (Cumulative) ▲8.0 |
(Single year) ▲22.2 (Cumulative) ▲36.2 |
Total (②) |
(Single year) +17.1 (Cumulative) +8.0 |
(Single year) +20.0 (Cumulative) +36.2 |
||||||
| Residual risk (①-②) |
(Single year) ▲0.9 (Cumulative) - |
(Single year) ▲2.2 (Cumulative) - |
|||||||||
- *1 Because the impact is minor, it is not included in the calculation.
- *2 For the prerequisites for calculating each risk, please see here.
NMF response policy
This table can be scrolled sideways.
| Category | NMF response policy and initiatives | |||
|---|---|---|---|---|
| Transition risk related | Policy | Introduction of carbon tax system | Risk mitigation/Opportunity |
Reducing carbon taxes by reducing GHG emissions ■Goal (KPI)
|
| Market | Increasing number of companies aiming to become carbon neutral Selection of properties with emphasis on energy creation and energy saving performance by tenants |
Maintaining and improving property competitiveness by improving the environmental performance of owned properties and obtaining environmental certification ■Goal (KPI)
|
||
| Changes in banks' lending decisions based on the Principles for Responsible Banking | ・Formulation of green finance framework, etc. ・Green loan borrowing, green bond issuance, etc. | |||
| Physical risk related | Acute | Increasing severity of natural disasters |
・When making a new investment: Investigation of climate change risks such as flooding risk during the due diligence process ・During property operation: Periodic sustainability risk assessment (including climate change risks such as flooding risk) ・Disaster countermeasures in terms of both hardware and software (Hardware side: waterproof version installation, road heating installation, etc.) (Intangible aspects: inland flood risk alert distribution system, BCP planning, disaster prevention training, etc.) ・Appropriate insurance against disaster risks |
|
| Chronic | Increase in average temperature | |||
4°C Scenario (reference)
This table can be scrolled sideways.
(hundred million yen)
| <Changes in the world> | <Risk details> | <Details of opportunities/risk reduction and corresponding costs> | |||||||||
| Category | Risk | Financial impact amount | Opportunity/Response cost | Financial impact amount | |||||||
|---|---|---|---|---|---|---|---|---|---|---|---|
| 2030 | 2050 | 2030 | 2050 | ||||||||
| Policy | Introduction of carbon tax system | Transition risk | Incurrence/increase of carbon tax burden | (Single year) ▲0.1 |
(Single year) ▲0.1 |
|
Risk mitigation | Reduced burden of carbon tax due to energy saving construction and introduction of renewable energy electricity | (Single year) +0.1 |
(Single year) +0.1 |
|
| Required cost | Cost increase due to introduction of renewable energy electricity | (Single year) ▲0.3 |
(Single year) ▲0.3 |
||||||||
| Market | Increasing number of companies aiming to become carbon neutral Selection of properties with emphasis on energy creation and energy saving performance by tenants |
Declining competitiveness of properties with poor environmental performance (properties that have not obtained environmental certification) | - | - | |
Opportunity | Improving the competitiveness of properties with high environmental performance (properties with environmental certification) | - | - | ||
| Risk mitigation | Restore and improve competitiveness by improving environmental performance (obtaining environmental certification) | - | - | ||||||||
| Required cost | Environmental certification acquisition and maintenance costs | - | - | ||||||||
| Changes in banks' lending decisions based on the Principles for Responsible Banking | Decrease in funding costs through green loans, etc. | ー(*1) | ー | ー(*1) | |||||||
| Acute | Increasing severity of natural disasters | Physical risk | Occurrence/increase in property damage due to floods and storm surges and decrease in rental income due to business suspension | (Cumulative) ▲8.8 |
(Cumulative) ▲49.5 |
|
Risk mitigation/Opportunity | Generation/increase of insurance income | (Cumulative) +8.8 |
(Cumulative) +49.5 |
|
| Increase in non-life insurance premiums | (Single year) ▲0.2 |
(Single year) ▲1.1 |
|||||||||
| Chronic | Increase in average temperature | Increase in cooling costs | (Single year) ▲0.1 |
(Single year) ▲0.3 |
Reduce heating costs | ー(*1) | |||||
| Total (①) |
(Single year) ▲0.4 (Cumulative) ▲8.8 |
(Single year) ▲1.5 (Cumulative) ▲49.5 |
Total (②) |
(Single year) +0.2 (Cumulative) +8.8 |
(Single year) +0.2 (Cumulative) +49.5 |
||||||
| Residual risk (①-②) |
(Single year) ▲0.6 (Cumulative) - |
(Single year) ▲1.7 (Cumulative) - |
|||||||||
- *1 Because the impact is minor, it is not included in the calculation.
- *2 For the prerequisites for calculating each risk, please see here.
Strategy: Nature-Related
Analysis Approach Based on LEAP
We adopted the LEAP approach for our TNFD analysis. The LEAP approach is a systematic approach that involves identifying value chains, interface with nature, and priority areas (Locate); identifying and evaluating dependencies on and impacts on nature at those locations (Evaluate); identifying and assessing the risks and opportunities arising from those dependencies and impacts (Assessment); and implementing and disclosing mitigation measures (Preparation).
LEAP Approach as Illustrated by TNFD
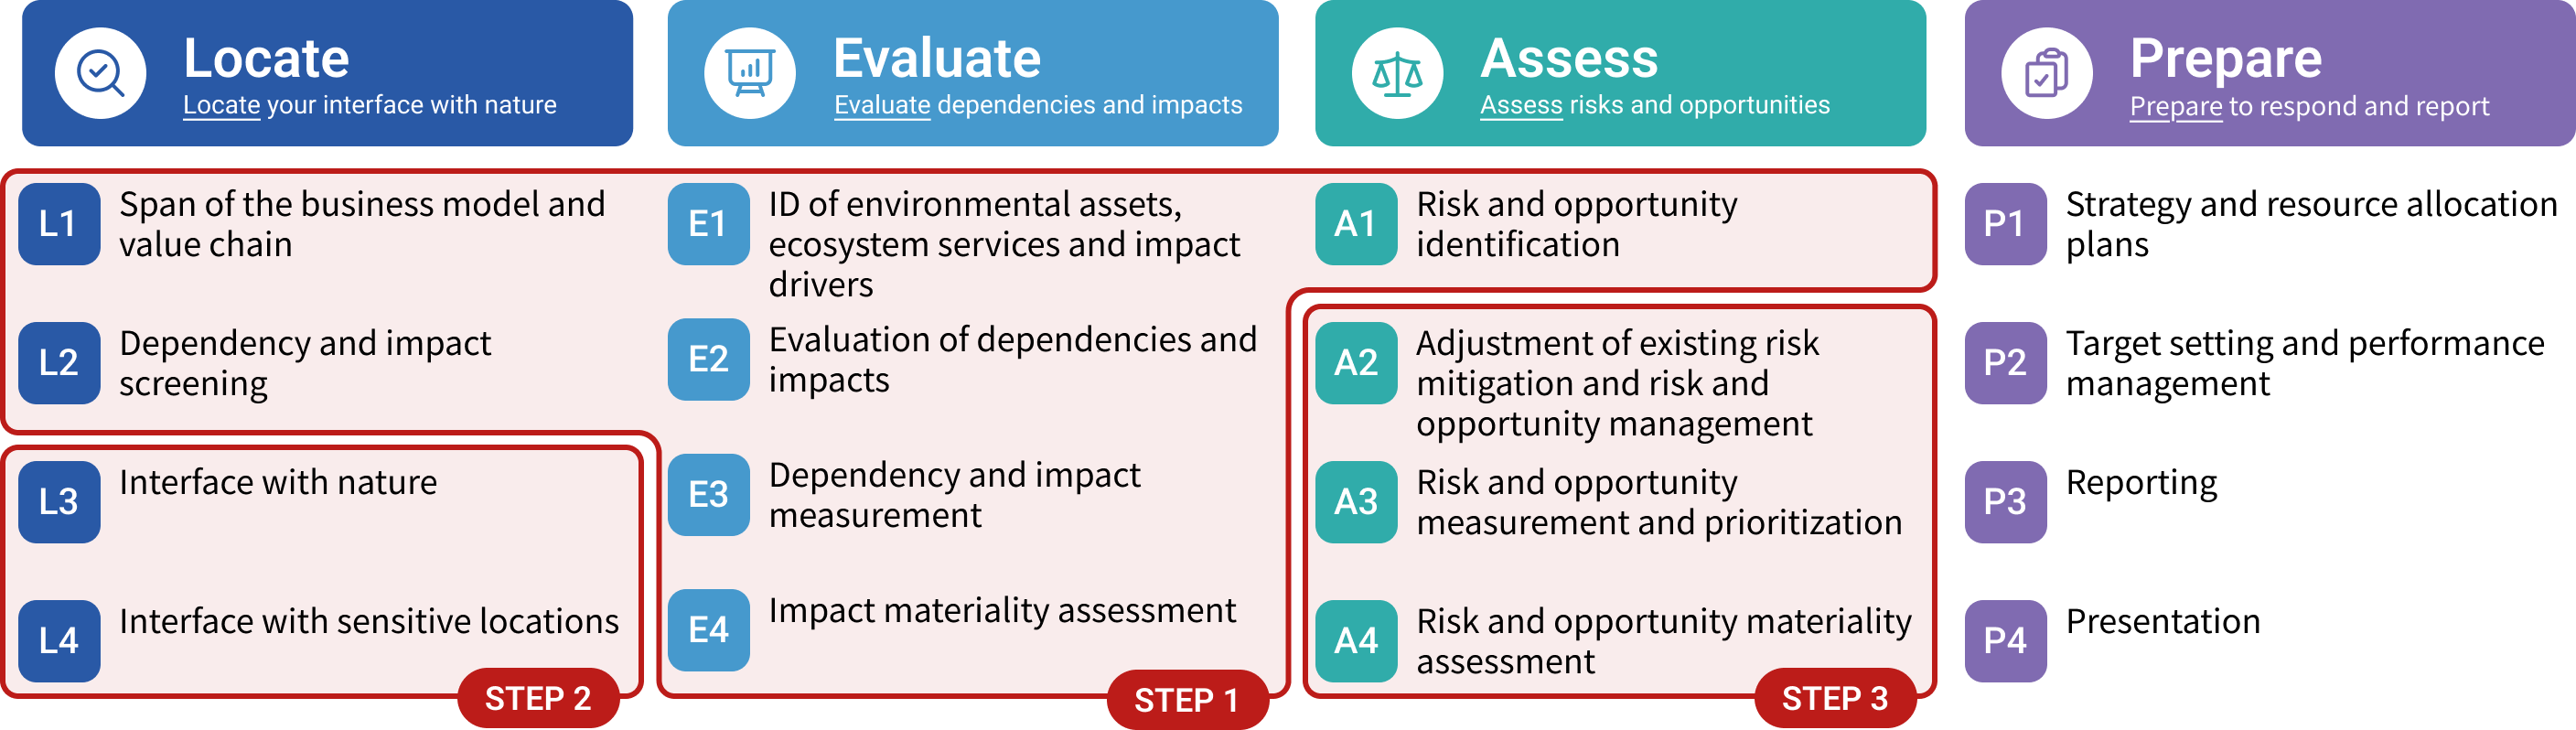
Approach Adopted by NMF
Evaluation of dependencies and impacts
- Organization of the value chain
- Evaluation of dependencies and impacts using ENCORE
- Investigation of risks and opportunities
Identification of priority areas
- Organize location data
- Evaluate locations of owned properties
Assessment of risks and opportunities
- Assess importance of risks and opportunities
STEP1Nature-Related Dependencies and Impacts
NMF used ENCORE* to analyze nature-related dependencies and impacts at operators within direct operations, as well as upstream and downstream in the value chain.
The following shows NMF’s value chain and the heat map resulting from the analysis.
Evaluation of dependencies and impacts
- Organization of the value chain
- Evaluation of dependencies and impacts using ENCORE
- Investigation of risks and opportunities
Identification of priority areas
- Organize location data
- Evaluate locations of owned properties
Assessment of risks and opportunities
- Assess importance of risks and opportunities
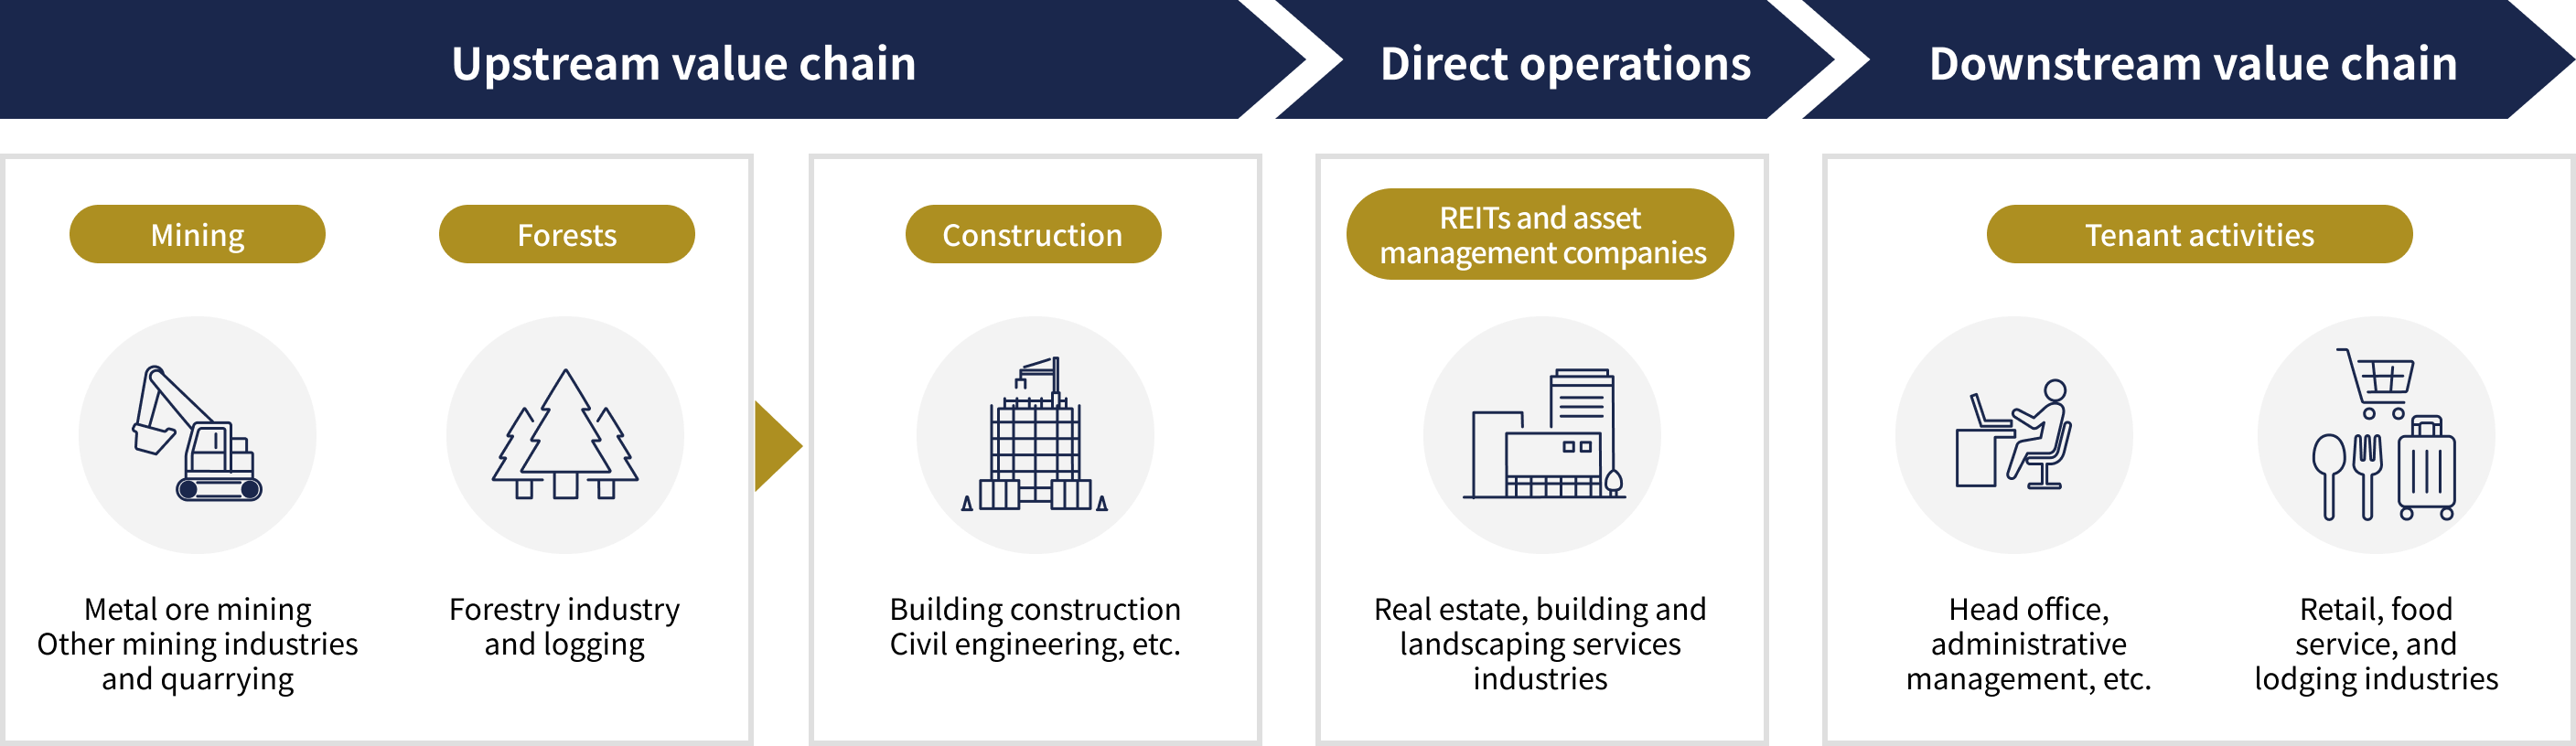
Dependencies (the extent to which business activities benefit from the natural environment, etc.)
This table can be scrolled sideways.
| (1) Food and resource supply | (2) Maintenance of soil and water environments | (3) Mitigation of pollution and waste | (4) Biological regulation functions | (5) Regulation of climate and weather | (6) Mitigation of disasters and natural risks | (7) Recreational and scenic value | (8) Cultural and intellectual value | |
|---|---|---|---|---|---|---|---|---|
| Upstream (real estate development) |
H | H | L | M | M | H | NA | L |
| Direct operations (real estate leasing) |
L | M | L | L | M | H | M | M |
| Downstream (various tenant business activities) |
L | M | M | L | M | M | M | M |
Impacts (the extent to which business activities affect the natural environment, etc.)
This table can be scrolled sideways.
| (1) Impacts on land, water bodies, and marine areas | (2) Consumption of water resources | (3) Emissions to the atmosphere | (4) Pollution load on water and soil | (5) Resource extraction and waste | (6) Direct disruption to ecosystems | |
|---|---|---|---|---|---|---|
| Upstream (real estate development) |
H | H | H | H | VH | H |
| Direct operations (real estate leasing) |
L | M | M | M | L | L |
| Downstream (various tenant business activities) |
L | M | M | M | M | M |
- * ENCORE (Exploring Natural Capital Opportunities, Risks and Exposure) is an online tool developed jointly by the Natural Capital Finance Alliance and UNEP-WCMC.
It enables users to qualitatively assess which natural capital each business activity depends on and impacts, and to what extent.
STEP2Properties in Areas Important for Biodiversity
NMF selected an appropriate dataset based on the TNFD-recommended sensitive location identification criteria and evaluated the natural conditions as well as water and ecosystem risks in the vicinity of its portfolio properties.
Evaluation of dependencies and impacts
- Organization of the value chain
- Evaluation of dependencies and impacts using ENCORE
- Investigation of risks and opportunities
Identification of priority areas
- Organize location data
- Evaluate locations of owned properties
Assessment of risks and opportunities
- Assess importance of risks and opportunities
TNFD-recommended sensitive location identification criteria
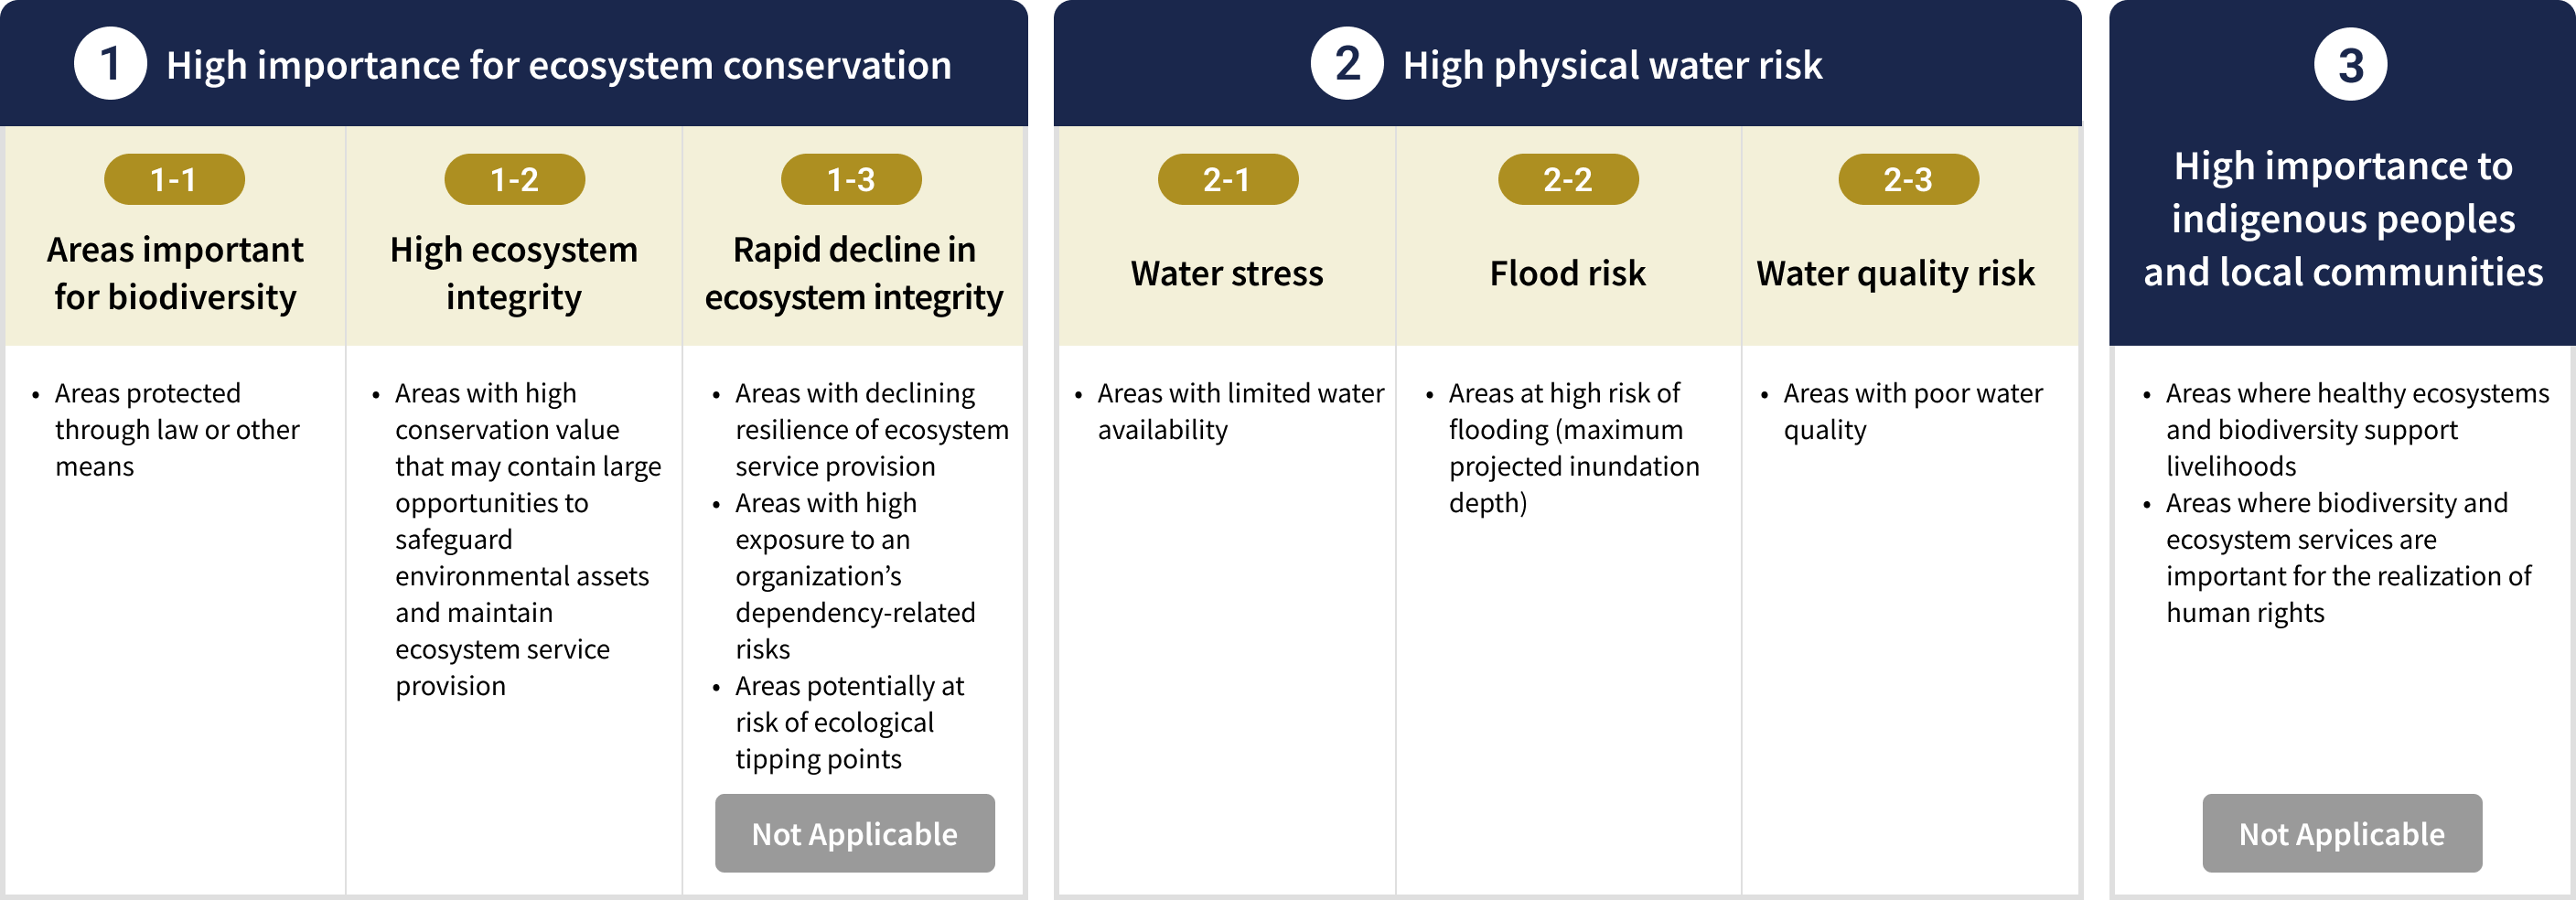
Based on the results of identifying dependencies, impacts, risks, and opportunities associated with direct operations, the following areas have been identified as important for biodiversity.
This table can be scrolled sideways.
| Location | 1. High importance for ecosystem conservation | ||
|---|---|---|---|
| 1-1 Areas important for biodiversity*1 | 1-2 High ecosystem integrity*2 | 1-3 Rapid decline in ecosystem integrity*3 | |
| Sendai, Miyagi Prefecture | |||
| Higashiyamato, Tokyo | |||
| Hanyu, Saitama Prefecture | |||
| Kashiwa, Chiba Prefecture | |||
| Kanazawa, Ishikawa Prefecture | |||
- *1: Areas protected by law or other means.
- *2: Areas with high conservation value that may contain large opportunities to safeguard environmental assets and maintain ecosystem service provision.
- *3: Areas with declining resilience of ecosystem service provision.
STEP2Analysis of Water Risks
NMF conducts analyses of water risks.
In addition, NMF promotes the establishment of disaster alerts and the installation of waterproofing equipment at properties to prepare for floods (for details, please see here).
STEP3Nature-Related Risks and Opportunities
The assessment results for nature-related risks and opportunities for NMF are as follows.
Evaluation of dependencies and impacts
- Organization of the value chain
- Evaluation of dependencies and impacts using ENCORE
- Investigation of risks and opportunities
Identification of priority areas
- Organize location data
- Evaluate locations of owned properties
Assessment of risks and opportunities
- Assess importance of risks and opportunities
This table can be scrolled sideways.
| Category | Potential risks and opportunities | Relevant indicators | Timeframe | Importance to business* |
|---|---|---|---|---|
| Physical risks (acute) | Extreme weather events such as floods, storms, landslides, and storm surges could damage assets, leading to facility operation shutdowns and restoration costs. | 2-2 Flood risk | Short-term | High |
| Opportunity | If demand for real estate offering access to high-quality green spaces increases, the value of properties located near important areas with high biodiversity will rise. There is also potential to implement ecosystem-conscious initiatives utilizing green spaces on site and obtain third-party certification. | 1-1 Areas important for biodiversity | Medium-term | Medium |
| Opportunity | For properties located in areas where rich ecosystem services remain, there is potential to implement initiatives in collaboration with the local community that contribute to the conservation of cultural value and the landscape. | 1-2 High ecosystem integrity | Medium-term | Medium |
- *Importance to business: Each risk and opportunity is assessed on a three-tier scale based on the two axes of (1) financial impact and (2) likelihood of occurrence; only those rated “Medium” or higher in importance are listed.
Risk Management
The risk management systems relating to sustainability of the asset management company to which NMF has entrusted operation of its assets are as set forth below.
At the time of investment decision
When making new investments in assets under management, the Investment Committee makes investment decisions in the due diligence process taking into consideration various investigations of climate change related risks. Specifically, with respect to the possibility of flooding and inundation of a target property, the inundation level and inundation history are investigated and confirmed using various hazard maps and the history of hydraulic engineering work implementation is also investigated and confirmed. In addition, the presence of environmental and energy-conserving facilities including acquisition of environmental certification, the status of business continuity planning, and other factors are confirmed.
During operation
The Sustainability Promotion Committee performs management and monitoring of overall risks relating to sustainability including climate change risks. Specifically, the status of implementation of energy-conservation measures to achieve greenhouse gas (GHG) emissions reduction targets (see (4) Metrics and Targets below for details) and the status of GHG reductions based on such implementation are monitored for each property, and this information is visualized to analyze the factors of increases or decreases in GHG emissions, and necessary countermeasures are investigated as needed. In addition, sustainability and risk assessment sheets are prepared for each property and the likelihood of climate change risks and other risks occurring is evaluated. These evaluations are conducted for a certain proportion of owned properties each year in accordance with a rotation of approximately five years for all properties. All sustainability initiatives, including climate change risk, are promoted based on the management and supervision of the Chief Executive Officer (Director) for Sustainability Promotion.
Metrics and Targets:Materiality
NMF is aware that solving environmental problems exemplified by climate change is an important management issue within its sustainable business and its business strategies for achieving sustainable business. Based on this understanding, NMF is investing in lower environmental impact buildings, taking measures to increase the efficiency of energy usage and reduce GHG emissions through the implementation of environmental and energy conservation measures at owned properties, and seeks to establish a low environmental impact portfolio.
Making owned properties greener
Key Performance Indicator
Raise the ratio of properties acquired green certification (with three stars or more or equivalent to) to 70% by 2030.
- ※Green certification (with three stars or more or equivalent to) refers to DBJ Green Building Certification (three stars or more) or BELS Certification (three stars or more), or CASBEE for Real Estate (B+ or higher)
- ※The figure is calculated based on the floor area of our properties excluding land.
- ※For actual results to KPI, please refer here.
Greenhouse Gas (GHG) Emissions
Key Performance Indicator (KPI)
Achieve net zero greenhouse gas (GHG) emissions by 2050
Achieve 80% reduction in greenhouse gas (GHG) emissions by 2030 (compared with the 2019 level) (Category 13 (Fuel and electricity related to tenant management assets))
Water Use
Key Performance Indicator (KPI)
Achieve 10% reduction in water use per floor area (intensity) in our portfolio
Metrics and Targets:Transition Roadmap
NMF has formulated a transition roadmap to achieve net zero GHG emissions by 2050.
NMF will endeavor to reduce total Scope 1, 2, and 3 (Category 13) GHG emissions by 80% compared with the 2019 level by 2030.
For the detailed action plan, please see here.
Toward 2050, NMF will endeavor to achieve net zero Scope 1, 2, and 3 GHG emissions.
In accordance with the definition of net zero emissions referred to above, NMF will reduce its total GHG emissions by 90% compared with the 2019 level and neutralize the remaining emissions by internationally accredited methods.
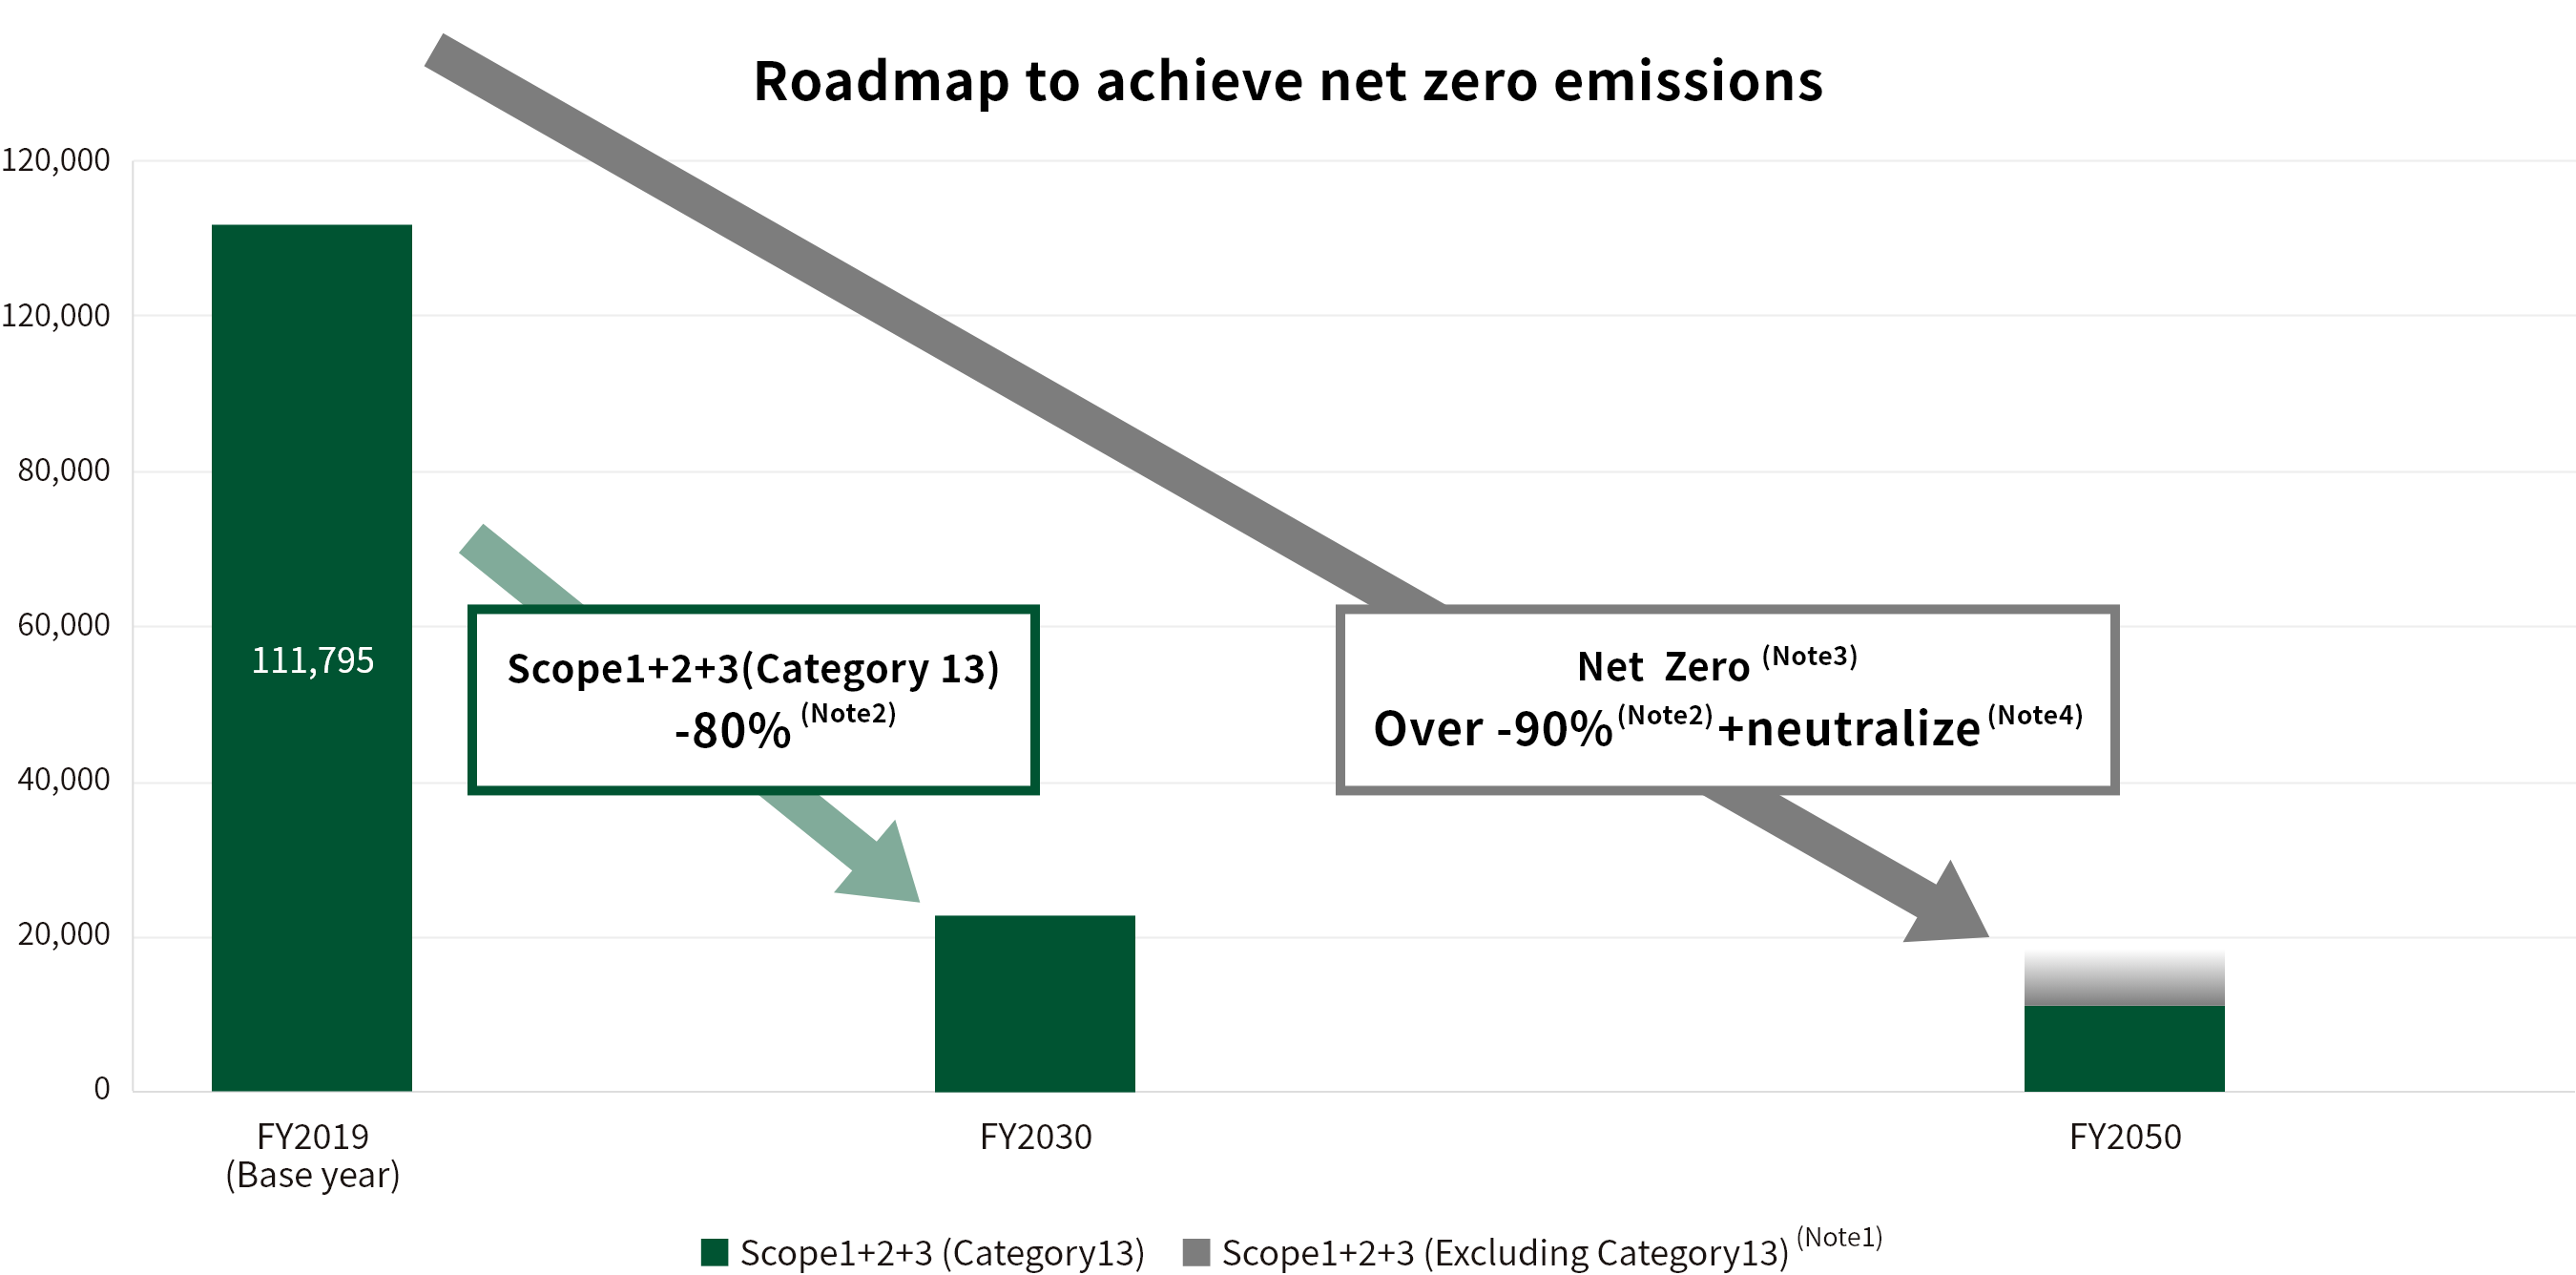
| (Note 1) | The heights of the bars in the graph are roughly depicted. Although at this point NMF has not set KPIs for items other than Scope 3 Category 13 items, NMF will work on reduction of emissions for other items. |
|---|---|
| (Note 2) | The FY2019 results are used as the base year. |
| (Note 3) | The achievement of net zero emissions for items other than Scope 3 Category 13 items will been set as KPIs. |
| (Note 4) | In accordance with the definition of net zero emissions, NMF will neutralize the remaining emissions by internationally accredited methods. |